Grafana: How to Set up a Private Data Source
Lately I’ve been enjoying using Grafana cloud. But in order to get Prometheus running you need to set up a Private Data Source. It’s actually really easy so in this article I will go over how to get it set up.
Open up Grafana and expand the “Connections” section, then choose “Private data source connect”.
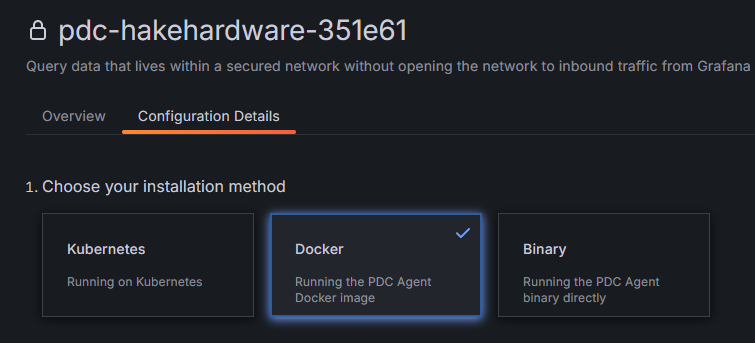
Then click “+ Add new network”, give it a name, then click “Add”. For installation method, choose Docker.
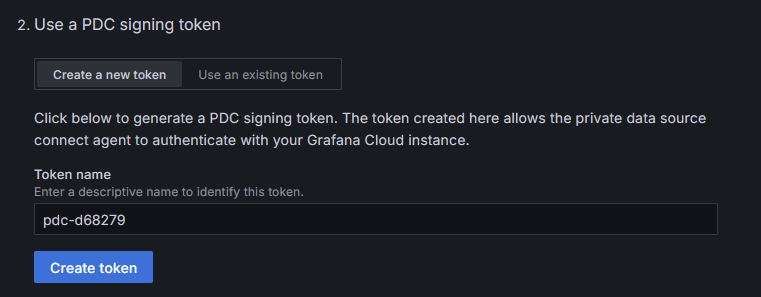
Then click “Create token” to create a token for your agent.
The token will be printed to the screen below the button. In Step 3 you will see a docker command, we are going to use a stack file instead, but you will need to copy certain values from this command into your stack file.
Go back to Portainer, and open up the base-stack (this assumes you have followed this guide). Then add the following under Prometheus, making sure to add the values from your docker command in the ‘token’, ‘cluster’, and ‘gcloud-hosted-grafana-id’:
  pdc-agent:
    image: grafana/pdc-agent:latest
    container_name: pdc-agent
    command: [
      "-token", "YOUR TOKEN HERE",
      "-cluster", "YOUR CLUSTER",
      "-gcloud-hosted-grafana-id", "YOUR ID"
    ]
    networks:
      spacenet:
        ipv4_address: 172.18.0.91
It should look something like this:
Now click “Update Stack” below, and it should deploy the pdc-agent container. Check to make sure it’s running.
Lastly, click “Test agent connection”, you should see “1 agent connected”. Now when you add new data sources you will select this agent as your pdc agent.
And that’s it. Happy monitoring!


