If you haven’t already, make sure to read Part 1.
Basic Guide to Monitoring Your Servers: Part 1
I have around ten servers on my home network and having a single location to visually check on them all is really nice. This guide walks through how I use Grafana, Prometheus, Cadvisor, and Node Exporter so that I can monitor them. If you haven’t already, check out my guide on getting Docker and Portainer set up.
So far we have:
Set up our Prometheus configuration
Deployed Prometheus as a docker container inside our base-stack
Opened the Prometheus web portal and ensured our endpoint was up
Got Grafana running
Added a the first Data Source
At this point, I want to note a few things. Currently, everything has been set up on a single server: Alpha. When you want to add monitoring to another server, you don’t need to do everything all over again. You only need to do the following:
Set up Prometheus as part of the base-stack (every server gets a base-stack)
Add Prometheus as a data source to Grafana
Node Exporter
The first thing that will be installed is Node Exporter. This runs as a service on the host. There are installation instructions in the Official Documentation but I will cover the steps here. You should at the very least ensure you are installing the latest version by updating the URL below with one from the Official Documentation.
wget https://github.com/prometheus/node_exporter/releases/download/v1.7.0/node_exporter-1.7.0.linux-amd64.tar.gzExtract
tar xvfz node_exporter-1.7.0.linux-amd64.tar.gzCopy that file we extracted to /usr/local/bin
sudo cp node_exporter-1.7.0.linux-amd64/node_exporter /usr/local/binAdd a new user that is specifically for Node Exporter. This user will actually run the service created in a moment:
sudo useradd --no-create-home --shell /bin/false node_exporterChange the ownership of the executable just copied to the user just created:
sudo chown node_exporter:node_exporter /usr/local/bin/node_exporterClean up the old tar file and folder in the home directory. Clean as you go!
rm -rf node_exporter-1.7.0.linux-amd64 node_exporter-1.7.0.linux-amd64.tar.gzA service will now be created. It’s really simple. Create a new service called ‘node_exporter’ with nano:
sudo nano /etc/systemd/system/node_exporter.serviceAnd then copy paste this in there:
[Unit]
Description=Node Exporter
Wants=network-online.target
After=network-online.target

[Service]
User=node_exporter
Group=node_exporter
Type=simple
ExecStart=/usr/local/bin/node_exporter

[Install]
WantedBy=multi-user.target
I won’t go over this in too much detail. But basically a simple service is being created that will start the node_exporter service.
Reload the Daemon
sudo systemctl daemon-reloadAnd then start the service
sudo systemctl start node_exporterNow in order to have node_exporter service start every time the computer is restarted, ensure its enabled.
sudo systemctl enable node_exporterCheck the status and make sure it says its running and enabled with:
sudo systemctl status node_exporterAmazing.
Node Exporter is now running. So how do we see the metrics? Prometheus of course. Update the ‘prometheus.yml’ file to include Node Exporter.
sudo nano /etc/prometheus/prometheus.ymlNow add this to the end:
  - job_name: 'node_exporter'
    static_configs:
      - targets: ['172.17.0.1:9100']
A new job called ‘node_exporter’ is added, but what is this IP? That isn’t from our bridge network which was ‘172.18.0.1’. This is the actual localhost from the perspective of Docker. So Prometheus is running as a Docker container, and Node Exporter is running on our actual host as a service. For Docker to reach that service, it uses the default network gateway that it sets up automatically. Not the one we created. In fact, if you go to the ‘Networks’ tab in Portainer you can see the default bridge network listed along side the “spacenet’ network.
Now that the prometheus.yml has been updated restart the container. Go into Portainer and click the prometheus container and then click restart.
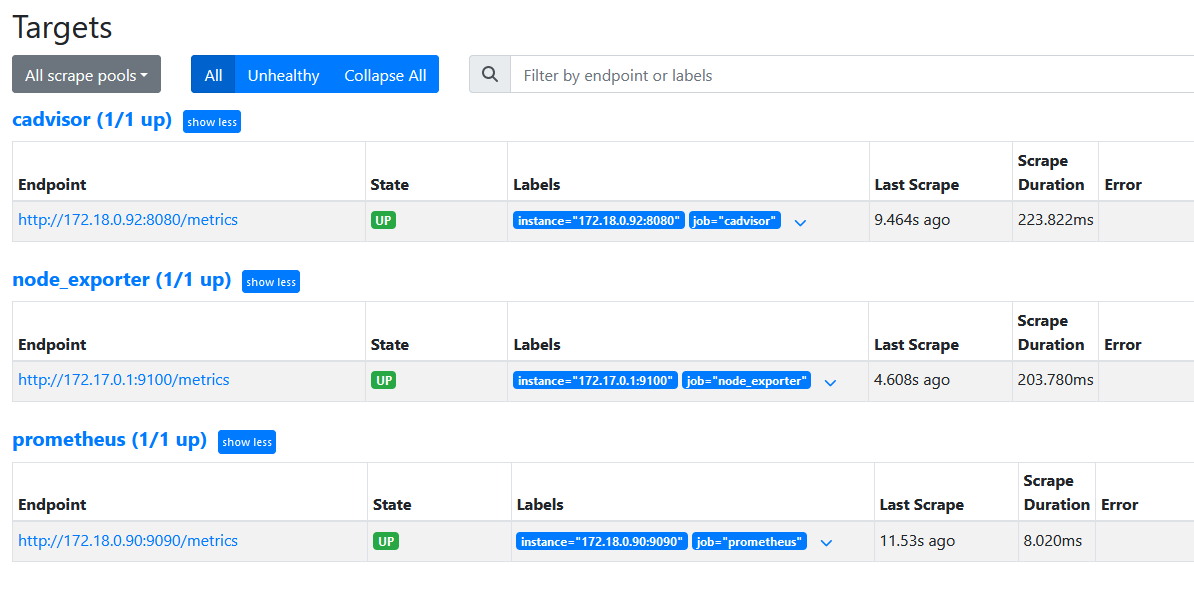
With Prometheus restarted, you can go back to the Web GUI for Prometheus and check out the “Targets” page again. You should now see ‘node_exporter’ listed there along with ‘promtheus’.
Note that because we restarted prometheus, it may take a few minutes before the state changes to ‘UP’, so give it some time.
And that is it for Node Exporter.
cAdvisor
So we can monitor our host now. But we also want to monitor our individual containers. That is where cAdvisor comes in. With this we can actually see how much RAM and CPU each container is utilizing, which can be very helpful.
Official Documentation: cAdvisor
This is actually really easy to install because it’s a container, and we will just add it to our stack. So go into Portainer. Then Stacks. Then click the stack we created earlier and then click ‘Editor’.
Okay so first we need to add a dependency to ‘prometheus’. So at the end of the entry for prometheus add:
    depends_on:
      - cadvisor
It should look like this:
Then below that, we need to add an entry for cAdvisor. So add this:
  cadvisor:
    image: gcr.io/cadvisor/cadvisor:latest
    container_name: cadvisor
    ports:
      - 8080:8080
    volumes:
      - /:/rootfs:ro
      - /var/run:/var/run:rw
      - /sys:/sys:ro
      - /var/lib/docker/:/var/lib/docker:ro
    networks:
      spacenet:
        ipv4_address: 172.18.0.92
We are adding another service for cadvisor using the latest cadvisor image. It will run on port 8080. We are doing a few bind mounts which allows it to gather metrics. And it will run on the ‘spacenet’ network we created.
Back to the shell, we need to update our ‘prometheus.yml’ file again. Open it and add the following:
  - job_name: 'cadvisor'
    static_configs:
    - targets: ['172.18.0.92:8080']
Just like before, we are setting up a new job, then adding the static IP we assigned it in the stack.
And just like before, restart the prometheus container in Portainer. You can verify everything is working by opening up Prometheus in your browser and checking the ‘Targets’ again. You should now see cAdvisor.
Grafana Dashboards
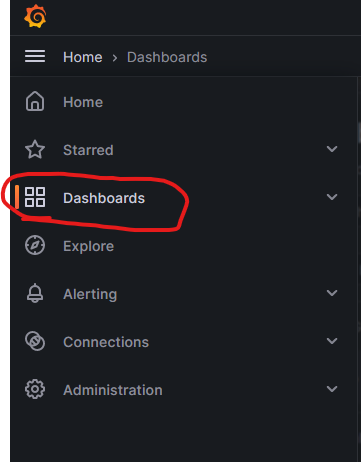
Lets create some dashboards. We will start with Node Exporter first. Back at the top left, click the hamburger again and then ‘Dashboards’.
Then click ‘New’ and ‘Import’
Where it says ‘Import via grafana.com’ enter ‘1860’ and then click ‘Load’. This is a pre-built dashboard that is already set. Convenient! You can leave most of the settings blank unless you want to rename the dashboard. Make sure you update the Prometheus data source to the one you created. Then click ‘Import’.
And now you should be able to access your Node Exporter dashboard! It should look something like this (make sure that the right datasource is selected at the top left):
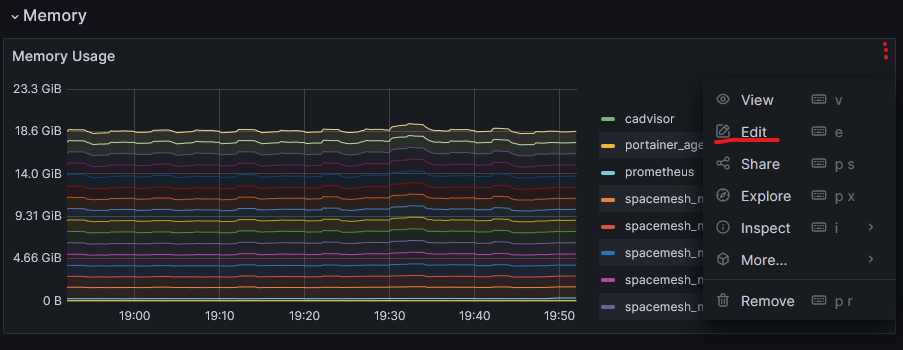
To set up the cAdvisor dashboard, do the same thing as before but this time enter in ‘14282’ for the ID to load the cAdvisor dashboard. There are two things that need to be fixed on this dashboard. On the ‘Memory Usage’ chart click the 3 dots. I drew where it should be with 3 red dots because it only appears when you mouse over the graph. You graph will also be blank. Then click ‘Edit’
Now paste in the following where I have underlined in the photo below. And then click ‘Run Queries’:
sum(container_memory_working_set_bytes{instance=~"$host",name=~"$container",name=~".+"}) by (name)Finally click ‘Save’ and maybe ‘Apply’. I can’t remember if you need to click both. Now go back to the main Dashboard and click the three dots for ‘Memory Cached’, and then click ‘Edit’ like before.
In the same place as last time, replace what is there with the following:
sum(container_memory_usage_bytes{instance=~"$host",name=~"$container",name=~".+"}) by (name)Click ‘Run Queries’ again and then ‘Save’ / ‘Apply’. You should now see the memory usage for the currently running containers. Congratulations you now have host and container level metrics!


