I have around ten servers on my home network and having a single location to visually check on them all is really nice. This guide walks through how I use Grafana, Prometheus, Cadvisor, and Node Exporter so that I can monitor them. If you haven’t already, check out my guide on getting Docker and Portainer set up.
Prometheus - Prometheus is an open-source monitoring and alerting toolkit designed for gathering, storing, and querying time-series metrics, commonly used for monitoring system and application performance in dynamic environments.
Grafana - Grafana is an open-source platform for data visualization and monitoring, enabling users to create and share dynamic dashboards across various data sources.
Node Exporter - Node Exporter is a Prometheus exporter that gathers system-level metrics from host machines, facilitating monitoring and visualization of Docker environments through Grafana dashboards
cAdvisor - cAdvisor (Container Advisor) is a lightweight container monitoring tool that provides real-time insights into resource usage and performance metrics of running containers in Docker or Kubernetes environments.
Prometheus
Start by creating a config file for Prometheus on your host.
Create a directory in ‘/etc/’ called ‘prometheus’
sudo mkdir /etc/prometheus Now create a config file with nano
sudo nano /etc/prometheus/prometheus.ymlThis file is where all of the ‘jobs’ publishing metrics will be specified. Throughout this article, this file will be updated as new jobs are added. For now, only Prometheus will be listed. Add the following to your ‘prometheus.yml’ file:
global:
  scrape_interval: 15s

scrape_configs:
  - job_name: 'prometheus'
    static_configs:
      - targets: ['172.18.0.90:9090']
A scrape interval of 15 seconds has been added, along with a single job called ‘prometheus’. The IP address listed here will be assigned statically by Docker, unless you plan to run a different IP you can leave everything as it is.
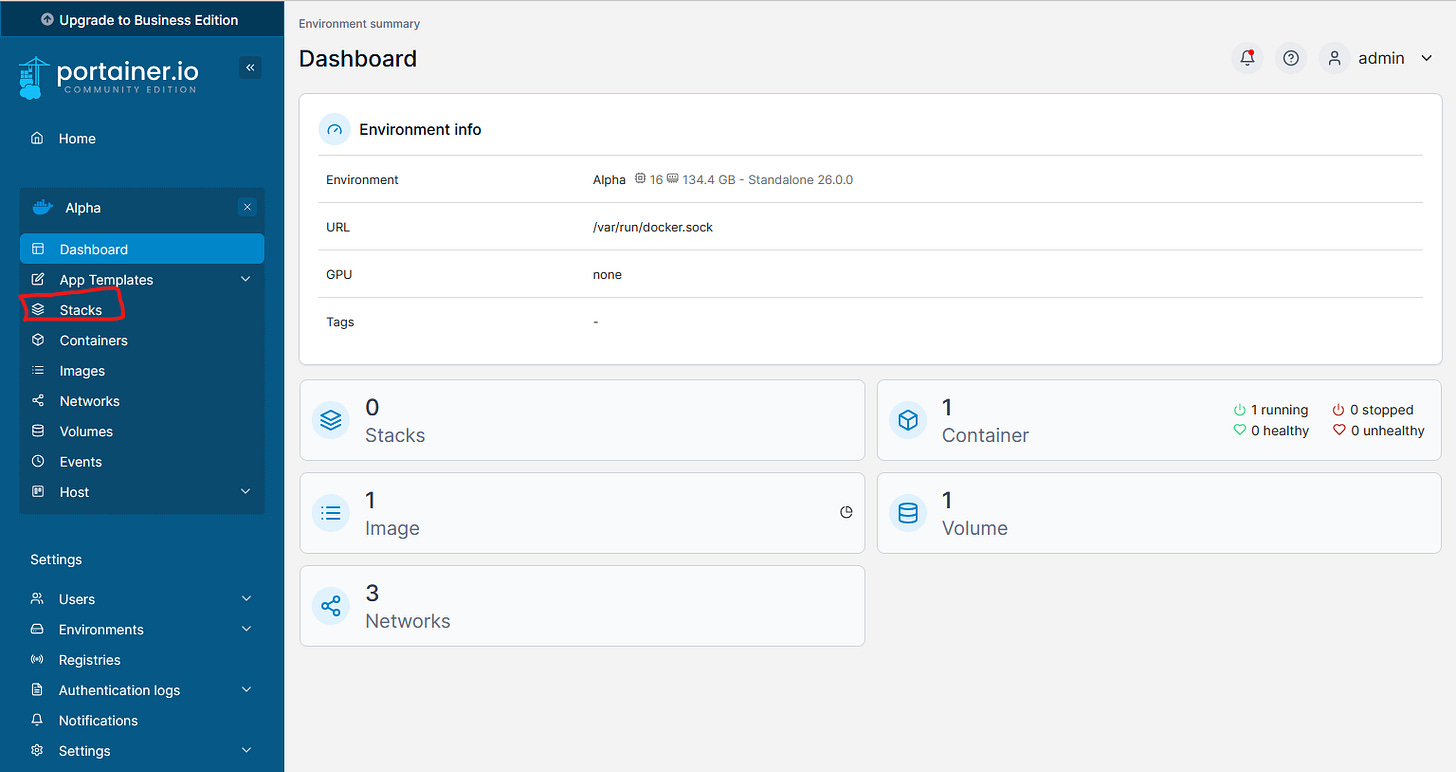
Open up Portainer and click the environment you wish to start monitoring. On the left side there will be a menu item for “Stacks”. Select that, then click “+ Add Stack”.
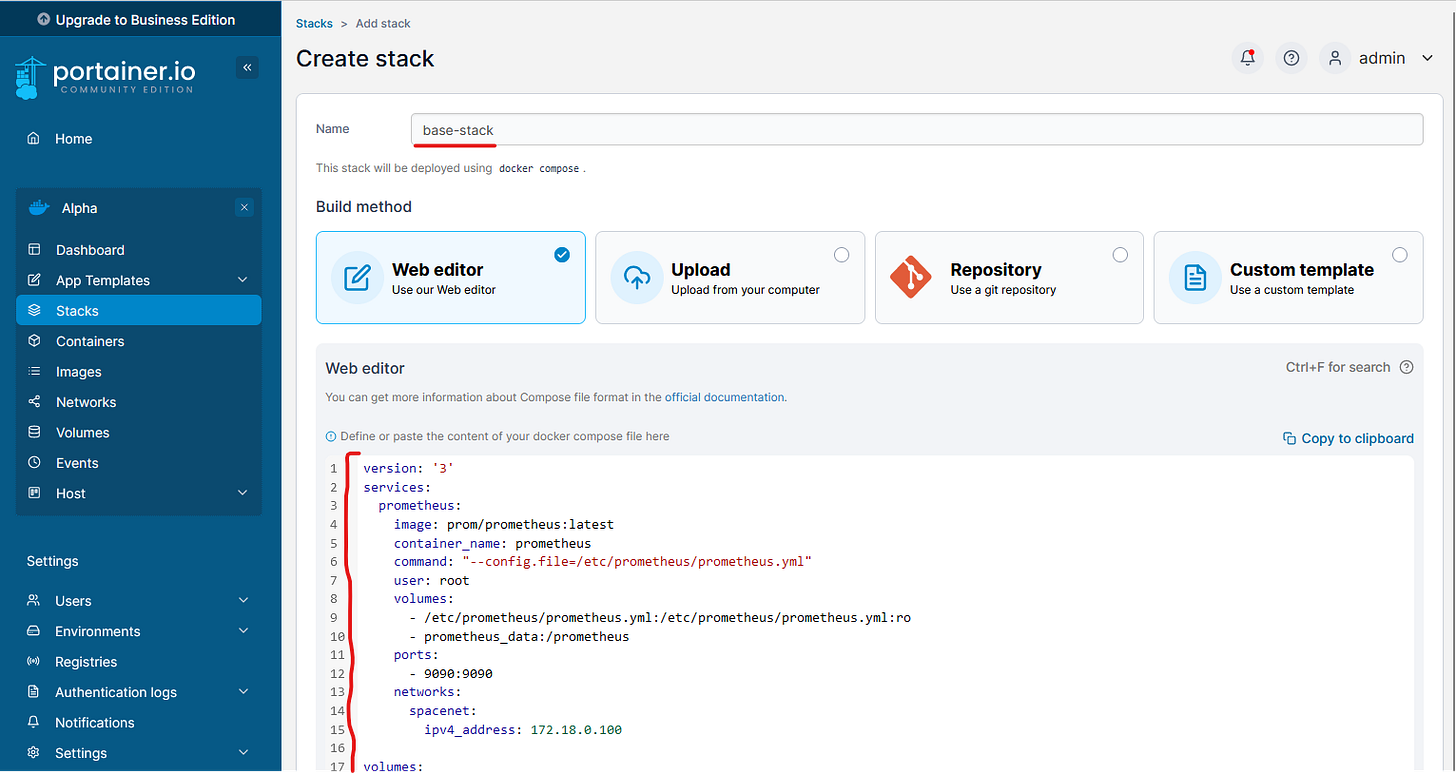
I call this first stack file my ‘base-stack’. As I build out my servers, I add new stack files and give them descriptive names, but this first stack is where I add generic containers that provide helpful functionality. You will see a ‘web editor’ section where you can add code to your stack file.
In the web editor section add the following for your stack file:
version: '3.8'
services:
  prometheus:
    image: prom/prometheus:latest
    container_name: prometheus
    command: "--config.file=/etc/prometheus/prometheus.yml"
    user: root
    volumes:
      - /etc/prometheus/prometheus.yml:/etc/prometheus/prometheus.yml:ro
      - prometheus_data:/prometheus
    ports:
      - 9090:9090
    networks:
      spacenet:
        ipv4_address: 172.18.0.90

volumes:
  prometheus_data:

networks:
  spacenet:
    driver: bridge
    ipam:
      driver: default
      config:
        - subnet: 172.18.0.0/16
          gateway: 172.18.0.1
This file defines the promtheus service that we will deploy as a container, along with a volume and a network. Starting from the top:
Docker Compose v3 is being used
The service Prometheus is being added
It will use the latest prometheus image
It will be named ‘prometheus’
When it executes, it will use the listed flags to load the ‘prometheus.yml’ config file that was created earlier
It will run as root
It will have two volumes, the first is a bind mount, which binds the config file to the specified location. The second is a volume we will create below
It will run on port 9090
It will use the ‘spacenet’ network we set up below
A volume called ‘prometheus_data’ is added which will be used above
A new network is created that is used above. It will be a bridge network using the default driver. Its subnet is 172.18.0.0/16 and its gateway is 172.18.0.1
Now click “Deploy stack” to kick everything off. Once the deployment is finished, ensure that the prometheus container has a state of “running”. If not, check the logs by clicking the ‘document’ icon under the ‘Quick Actions’ column.
Prometheus is now running, and you can confirm by opening up a browser and going to the the address it’s running on. This isn’t the IP from the stack file, this is the IP of the server running Prometheus:
https://192.168.69.101:9090Later, we will use this web UI to make sure Prometheus can connect to other services and applications that we want to monitor. Once Prometheus has been opened in the browser, at the top there is a menu icon for “Status”, click that and then click “Targets”. On the Targets page, there should be an entry for Prometheus. After adding more jobs to the config this page can be used to confirm the connections ares made. The state for Prometheus should be “UP” to indicate it is working.
Grafana
The next thing to do is connect Prometheus to Grafana. There are two ways to run Grafana: Self Managed or Cloud. There are benefits to doing it either way, but I have been using the cloud account, which provides a lot of value for free. This article will not cover installation instructions as they are covered well in the official docs. The instructions are here: Grafana
However, if you choose to run the Cloud version, you will need to set up a Private Data Connector (PDC). You can check the guide on how to do that here:
Grafana: How to Set up a Private Data Source
Lately I’ve been enjoying using Grafana cloud. But in order to get Prometheus running you need to set up a Private Data Source. It’s actually really easy so in this article I will go over how to get it set up. Open up Grafana and expand the “Connections” section, then choose “Private data source connect”.
Adding a Data Source
Under the “Connections” menu item, select “Data sources”.
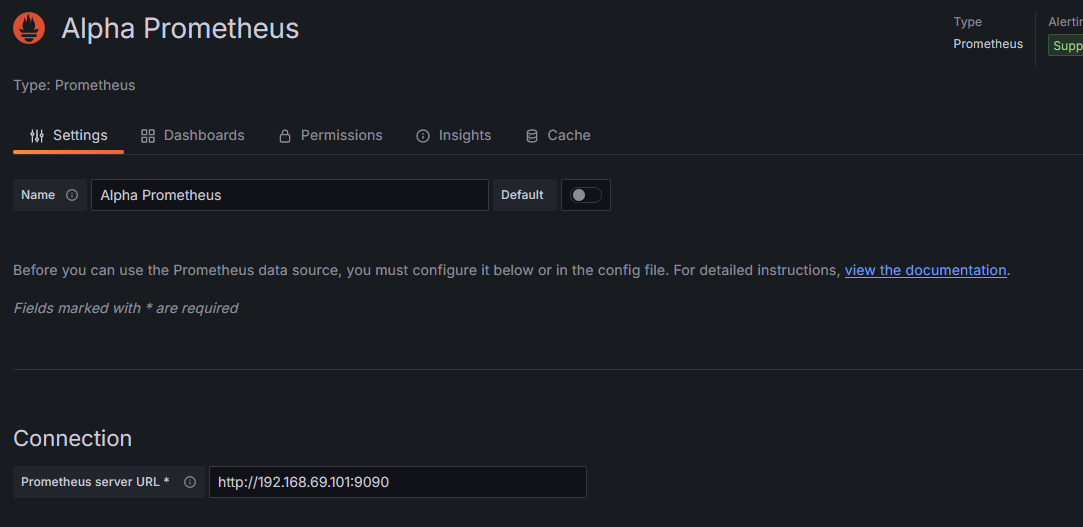
Then click “+ Add new data source”. Add the name you want to use, in my case “Alpha Prometheus”, then enter the URL to your prometheus server. This should be the same URL you used above to view your targets.
If you are using a Private Data Source as described above, you also need to select the Private data source:
Then click “Save & test”. If all is well, you should see a success notification.
Prometheus is now hooked up to Grafana and we can start publishing metrics. We will do this with cAdvisor and Node Exporter. Check out the next article to get started on that:
Basic Guide to Monitoring Your Servers: Part 2
If you haven’t already, make sure to read Part 1. So far we have: Set up our Prometheus configuration Deployed Prometheus as a docker container inside our base-stack Opened the Prometheus web portal and ensured our endpoint was up Got Grafana running


